技術情報

Matomo データを使用して Looker Studio で時系列チャートを作成する

Matomo Connector for Looker Studio を設定すると、Matomo データを使用して時系列チャートを作成できます。Matomo コネクタで作成されたすべてのデータソースは、自動的に Date ディメンジョンを持ちます:
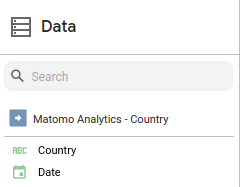
A screenshot of the Looker Studio data pane with the details for a data source named "Matomo Analytics - Country" expanded. Only two dimensions are shown in the screenshot, Country and Date.

このディメンジョンを使用すると、Looker Studio で選択した日付範囲に基づく日単位のメトリックを提供できます。

したがって日付ディメンジョンを Looker Studio レポートに追加すると、Looker Studio は自動的に時系列チャートを追加します。例えば下記です。
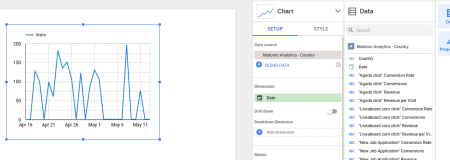
A screenshot of a time series visualization in Looker Studio that's using data from the Matomo Countries report. It displays the Visit count for days between April 16 2023 and May 11 2023. The chart properties pane and the Data pane are both open on the right hand side. In the Chart properties pane, the Date dimension is selected as the dimension for the chart.

より多くのデータをチャート化するために、より多くのメトリクスやディメンションを時系列にドラッグすることができます。ブレイクダウン・ディメンジョンとして国を追加するとこのようになります:
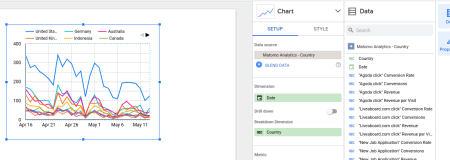
A screenshot of a time series in Looker Studio using the data from the Matomo Countries report. In contrast to the previous screenshot, there are more than 6 separate serieses plotted in the graph, one for each country in the report. Each series displays visits for days within April 16 and May 11, 2023. The chart properties pane is open showing the Date dimension selected as the dimension, and the Country dimension selected as the Breakdown dimension.

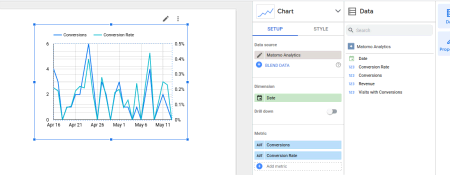
以下は換算そして換算率時間をかけて特定の目標を達成します:

Another screenshot of a time series in Looker Studio, this time plotting the Conversions and Conversion Rate of a specific goal for the days of April 16th to May 11th, 2023. The chart properties pane is open as well with the Date dimension selected for the chart's dimension, and with two metrics selected: Conversions and Conversion Rate.

ゴールのメトリックス・レポートでデータ・ソースを構成すると、上記のような時系列を作成できます。レポートには、Goals > Goal Nameのような名前を付けます。コンバージョン率メトリクスを追加したら、必ず正しい軸を使用してください。