Looker StudioでMatomoのデータを設定、表示するには?
Looker Studio は、複数のソースからデータを取得し、そのデータを使用して詳細でカスタマイズされたレポートを作成できる強力なツールです。Matomo Analytics Connector for Looker Studioは、Looker StudioでMatomoのレポートを利用できるようにします。
Matomo メトリクスを Looker Studio で利用できるようにすることで、データ分析に新たな可能性が生まれます:
- Matomoのデータを全く異なるデータソースとブレンドし、組織全体のインサイトを得ることができます。
- 数あるコミュニティのビジュアライゼーションの中から、お望みの方法でデータを表示できます。
- あなたやあなたのレポートのユーザーにとって最も重要なデータに特化したレポートを作成します。
Looker Studioのユーザーで、作成したレポートにMatomoのデータを使用したい場合、このガイドでその方法をご紹介します。
Matomo Connector for Looker Studio の要件
Matomo Connector for Looker Studio を使用する前に、以下の要件を満たしていることを確認してください:
- このコネクタは多くのバージョンの Matomo で動作しますが、Matomo のバージョン 4.14 以降で最もよく動作します。4.14以前のバージョンでもデータは表示されますが、メトリクスは正しくフォーマットされず、操作が難しくなります。
- Matomoに使用するURLを以下のようにメモしておく必要があります。Matomo の URL は、Looker Studio に接続する際のユーザー名として使用されます。.
- コネクタを使用する前に、Matomo で認証トークンを作成する必要があります。以下の手順で作成できます。この FAQ の手順に従って、認証トークンを作成してください。
- もちろん、Looker StudioにアクセスするにはGoogleアカウントが必要です。
Matomoデータへの接続と最初のレポートの追加
Matomo Connector for Looker Studio を使用するには、Looker Studio のワークフローに従って新しいデータソースを追加します。
- Matomo コネクタを追加したいレポートを開きます。レポートを開きます。データ追加ボタンをクリックします。

- 読み込まれたコネクター検索シートで、Matomo Analyticsを検索します。

- Matomo用のサードパーティコネクタはいくつかありますが、必ずMatomoが作成した公式のものを選んでください。

- [認証]をクリックして、Looker Studio 用の Matomo コネクタを有効にします。コネクタは、Looker Studio でリクエストを処理するためにのみ Matomo レポートにアクセスすることに注意してください。Google アカウントからメールアドレスやその他の個人情報を収集することはありません。

- コネクタが Matomo インスタンスにアクセスできるように、Matomo 認証情報を入力し、[submit] をクリックします。
- ユーザー名には、Matomoインスタンスへの完全なURLを入力します。https://で始まり、例えばhttps://matomo.myorganization.com/。
- トークンにはLooker Studio コネクタ用に作成した認証トークンを入力するか、またはこの FAQ の手順に従って、認証トークンを作成してください。.

セキュリティに関する注意事項:これらの認証情報を入力することで、Matomo ConnectorはあなたのデータをLooker Studioに取得することができますが、コネクタとMatomoの作者である私たちがあなたのMatomoデータにアクセスすることはありません。Matomo への機密の認証情報は、入力したユーザのみが直接アクセスできます。Matomo Connector for Looker Studio は、ターゲット Matomo からデータを要求するときと、Looker Studio ダッシュボードを生成する目的でのみ、あなたの認証情報にアクセスします。コネクタをテストしたい場合は、https://demo.matomo.cloud/ に接続してパブリックデモを使用できます。トークンに anonymous と入力してください。
- 接続するウェブサイト/測定可能値を選択し、[Next] をクリックします。

- レポートを接続するための設定ワークフローが表示されます。

- Reportでは、Looker Studioで見たいレポートを選択します。例として、「Visitors > Country」レポートを選択します。
注:Looker Studioの仕組み上、コネクタは1つのレポートにしか接続できませんが、これを回避するために複数のデータソースを設定することができます。このガイドの次のセクションでその方法を説明します)。 - セグメントでは、データを取得するセグメントを選択します。デフォルトでは、コネクタはAll Visitsセグメントからデータを取得しますが、必要に応じて変更できます。
- (オプション) Allow “Segment” to be modified in reports.チェックボックスをチェックして、セグメントをパラメータ化することもできます:

これにより、レポート作成者は新しいデータ・ソースを構成することなく、セグメントを変更できるようになります。 - 最後のオプション、Default Row Limit は無視してもかまいません。(デフォルトでは、コネクタはレポートのすべてのデータをフェッチしますが、特定の Matomo レポートが特に大きい場合、Looker Studio の制限に遭遇する可能性があります。この場合、ここでフェッチする行数の制限を設定する必要がありますが、今は考える必要はありません。必要であれば、いつでも戻ってくることができます)。
- Reportでは、Looker Studioで見たいレポートを選択します。例として、「Visitors > Country」レポートを選択します。
- レポートとセグメントを選択したら追加ボタンをクリックします。コネクタをレポートに追加するかどうかを確認するモーダルがポップアップ表示されたら、確認します。

すべての手順が正常に完了すると、新しいデータソースがデータパネルで利用できるようになります。
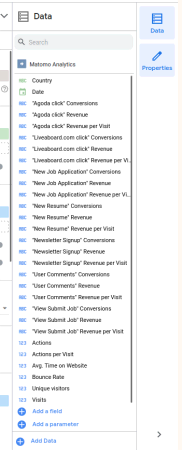
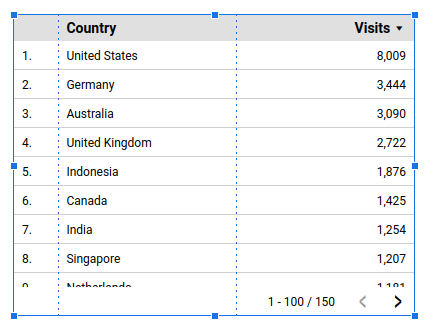
レポート・キャンバスにメトリクスとディメンションをドラッグすることで、チャートを作成できるようになりました:
2つ目のレポートの追加
2つ目のMatomoレポートをLooker Studioで利用できるようにするには、新しいレポートで新しいデータソースを作成する必要があります。手順は上記の手順と同じです。
上記の手順を再度実行すると、Looker Studio レポートに 2 つのデータソースが表示されます。新しいデータソースが表示されない場合は、新しいデータをロードするためにデータパネルを閉じて再度開く必要があるかもしれません。
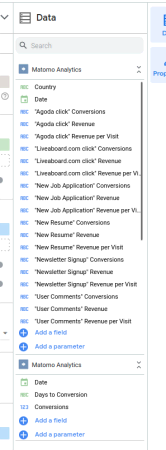
どちらのソースも Matomo Analytics という名前であることに注意してください。これは混乱を招き、一度に必要な特定のデータ・ソースを探すのが難しくなります。そこで、名前を変えてみましょう。
Looker StudioでMatomoレポートの名前を変更する
データ・ソースの横にある鉛筆のような編集ボタンをクリックします:
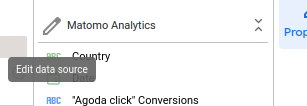
ポップアップの左上に、コネクタの名前が表示されます。これをクリックして、別のタイトルを入力できます。特定のレポートに関するより良い説明を含むように編集することをお勧めします。例えば、「Matomo Analytics (Country)」です。
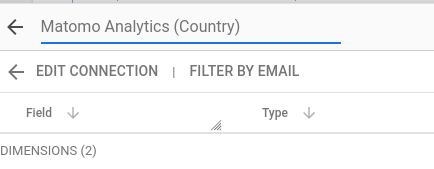
クリック完了または終了すると、名前の変更が保存されます。
次に何をすべきでしょうか?
MatomoをLooker Studioに接続することで、意思決定に役立つダイナミックな時系列レポートを作成することができます。詳しくはこちらをご覧ください、Looker Studioで時系列チャートを作成する方法はこちらをご覧ください。.

